Accordion’s quarterly Turnaround & Restructuring market update


Accordion’s Quarterly Turnaround & Restructuring Market Update
The Accordion view
Credit markets continue to show strength—and with a “soft landing” looking more and more likely (if not now the consensus view), the fundamental outlook remains positive. Leveraged loans and high-yield bonds posted positive returns in the quarter, driven by a powerful year-end stock market rally, falling Treasury yields, declining inflation, resilient corporate earnings, and more friendly Fed policy rhetoric. Leveraged loans additionally posted their best year of returns since 2009, aided by substantially higher SOFR rates. Private credit portfolio marks (BDC fair value to cost) were near flat versus the prior quarter, with underlying portfolio company revenue and EBITDA continuing to trend positively.
In terms of market activity, the real action is taking place after Q42023, thus far reaching into 2024. After months of punitive conditions, the leveraged loan and high-yield bond markets are open for business as issuers take advantage of tightening spreads. Q12024 leveraged loan issuance through February represents the best issuance quarter since Q22022 (with one month still remaining in the quarter), and high-yield bond issuance to-date is the third best start to a year on record (behind only 2020 and 2021). The majority of new issuance is for refinancing purposes (as opposed to M&A) as companies take advantage of tighter spreads to opportunistically extend debt maturities.
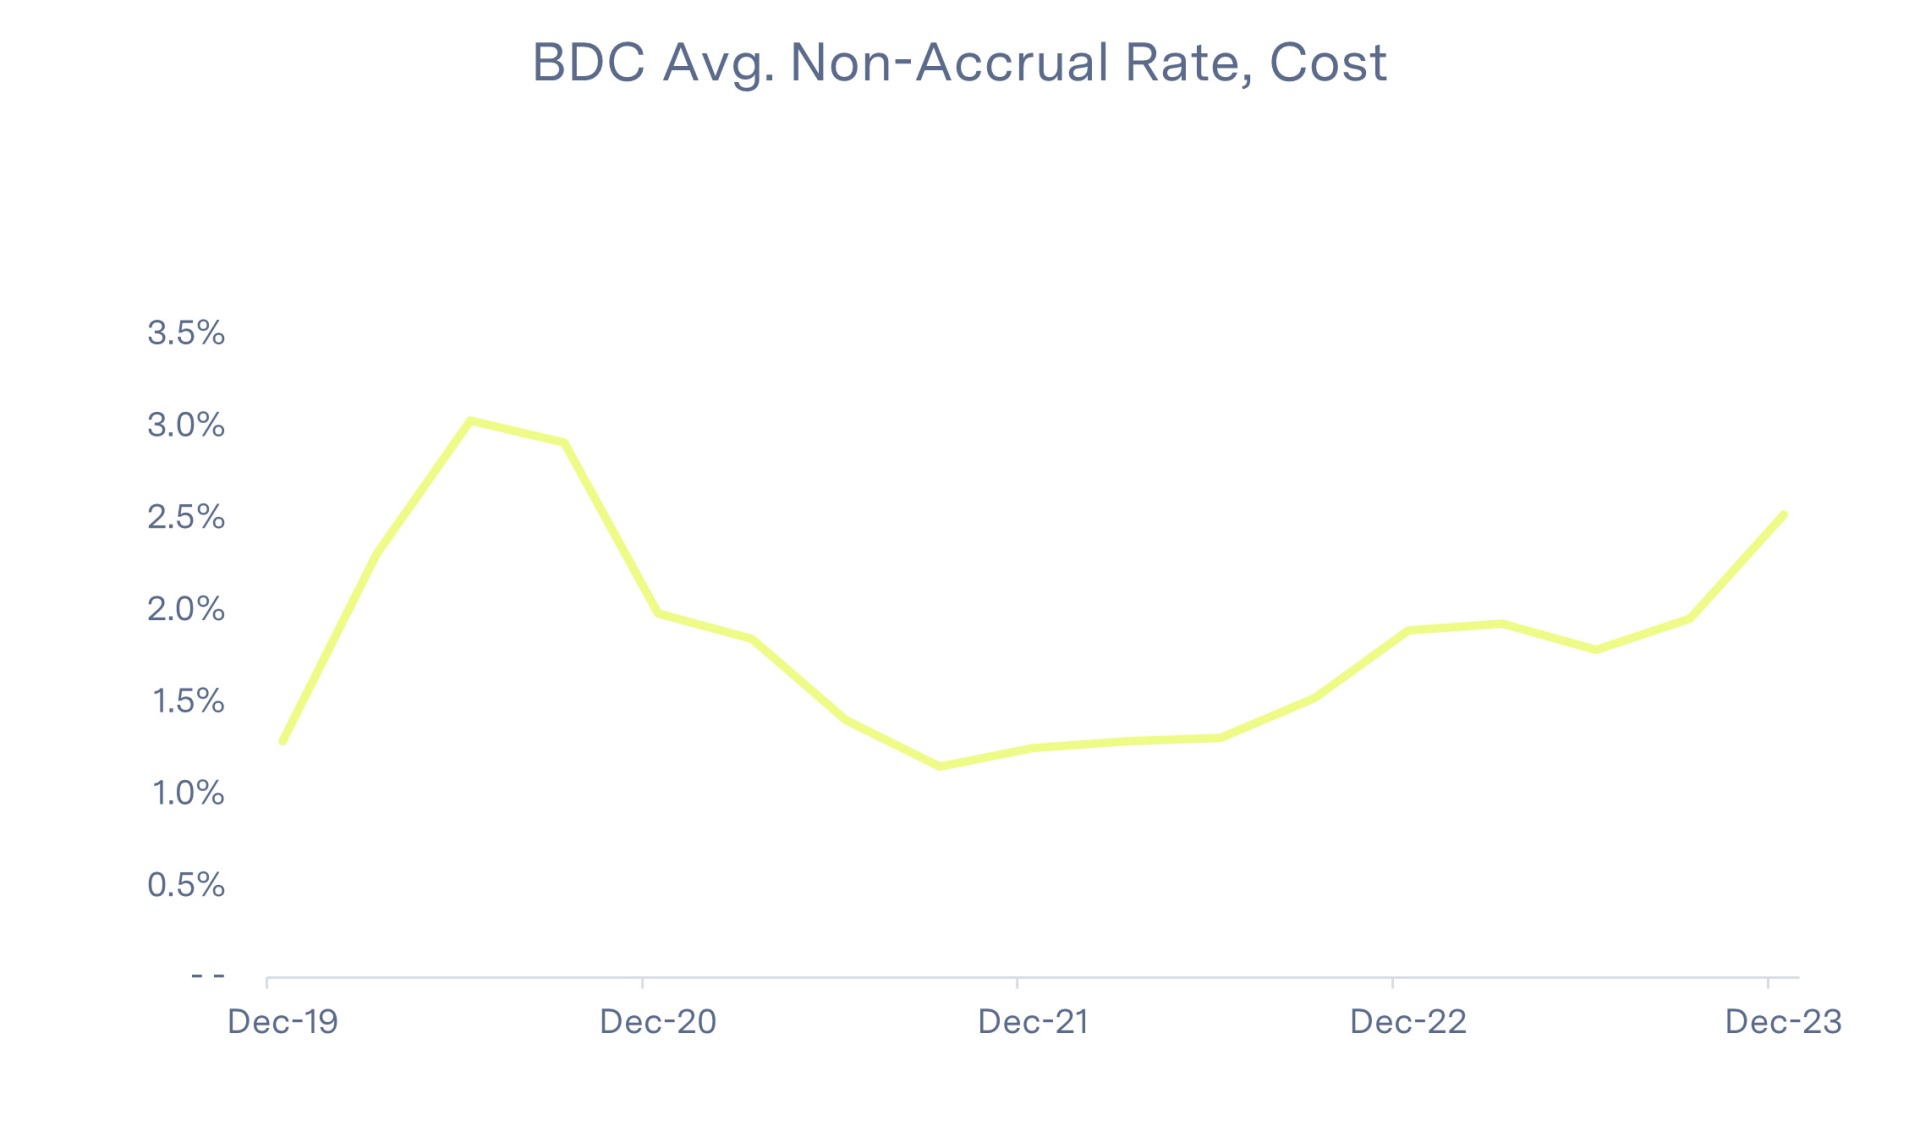
Credit distress has begun to increase, though this likely represents a “normalization” of conditions versus any material macro deterioration in fundamentals. Commercial Chapter 11 filings continue to trend higher, with Q42023 filings representing the largest quarter of filings since Q32020. The leveraged loan default rate increased versus the prior quarter and now stands in line with historical medians, while high-yield bond distress rates were near unchanged. BDC non-accruals have similarly increased over prior quarters but remain below historical averages.
We continue to believe a slow and methodical pick-up in distress is likely, with ongoing growth in turnaround and restructuring activity. That said, any increases in distress are likely to be idiosyncratic to an issuer or industry, as opposed to a material macro event. A “higher-for-longer” rate regime would additionally increase distress for borrowers relying on debt service reductions—though markets currently imply three rate cuts by the end of 2024.
Quarterly topical: Private credit is big & getting bigger
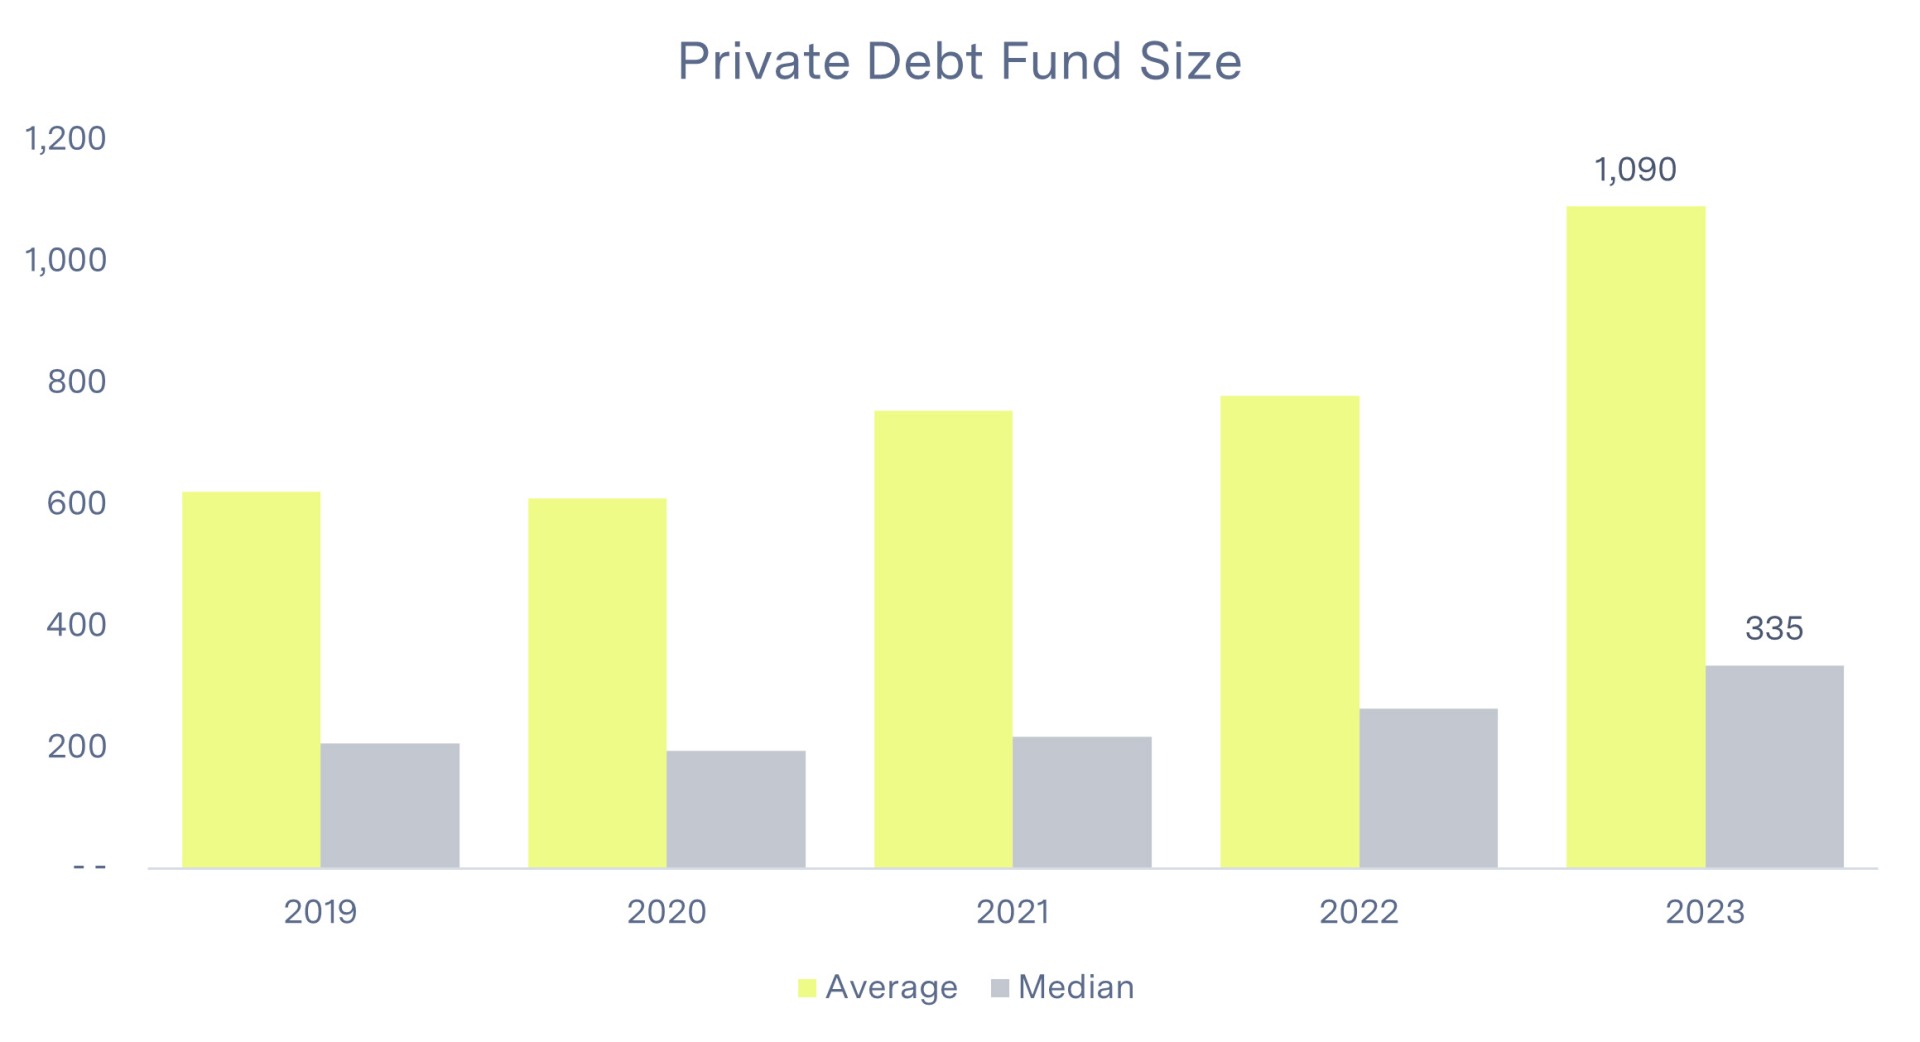 Many have echoed the sentiment that the “golden age” of private credit is here and here to stay. With record fundraising in recent years and meaningful dry powder, growth in the asset class is obvious and well publicized in major financial publications. As AUM has increased, so has average fund size. Per PitchBook, private debt funds raised in 2023 had an average size of $1.1B, up from $621M in 2019. Median fund size shows a similar growth trend, from $206M in 2019 to $335M in 2023.
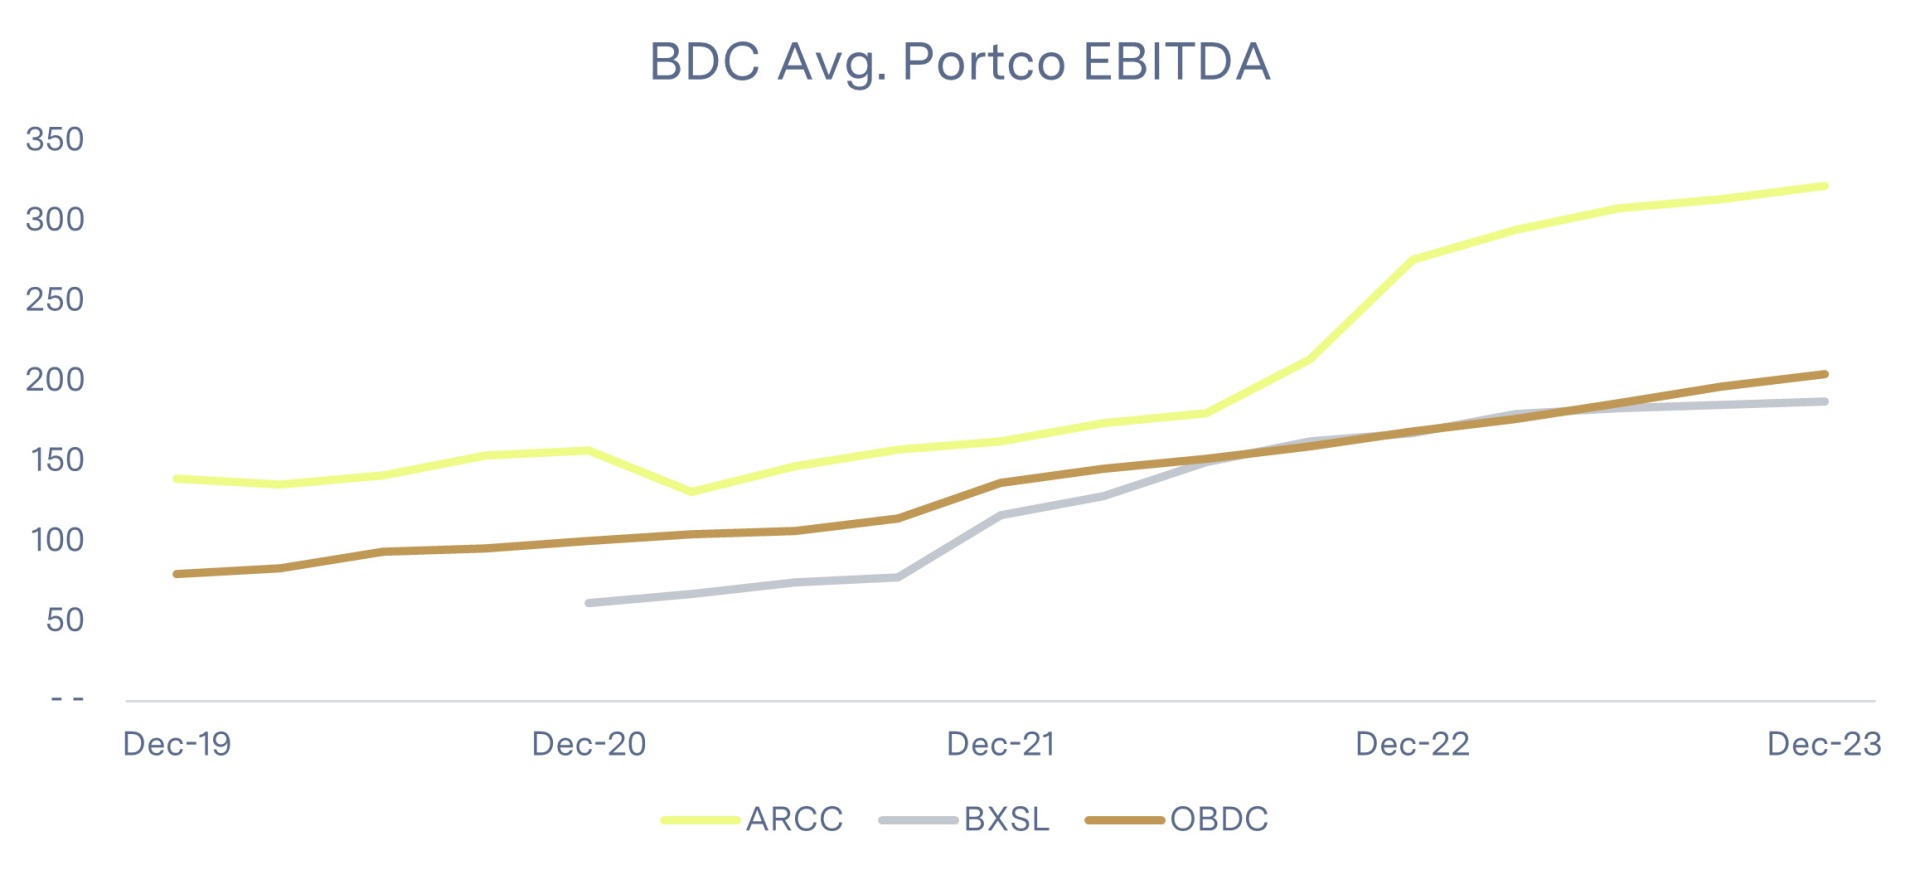
Potentially less obvious is the extent to which private credit has moved “up market.” Growth in private credit is not only a function of capital raised; private credit is increasingly able to target larger LBOs that historically represent the mainstay of the traditional syndicated loan market. An analysis of three large-cap business development companies (BDCs) underscores this trend. As of Q42023, weighted average portfolio company EBITDA was:
- Ares Capital Corp. (ARCC): $322M, up from $139M in Q42019.
- Blackstone Secured Lending Fund (BXSL): $192M, up from $61M in Q42020.
- Blue Owl Capital Corp. (OBDC): $204M, up from $79M in Q42020.
 At this size, private credit can directly compete with the broadly syndicated market and has gained market share in recent years. For example, applying a 4x to 6x leverage multiple to EBITDA of $200M (approximately in line with average portfolio company EBITDA for BXSL and OBDC) would imply these funds are comfortable funding debt of $800M to $1.2B for individual new deals. Additionally, given many private credit deals are “clubbed out” across various firms and funds, actual funding capacity for a new specific deal is likely higher. To further demonstrate this point, in 2023, private credit refinanced $16B+ of debt out of the broadly syndicated market—including large deals like Finastra ($4.8B facility) and Hyland Software ($3.4B facility).
However, the broadly syndicated market is fighting back, most notably in the new year. Thus far in 2024, 21 companies have issued a broadly syndicated loan to refinance $8.3B in debt previously provided by private credit. Healthcare data company Cotiviti additionally elected to finance a $5B facility through the syndicated market, including a $4.4B floating-rate loan at SOFR + 350, after private credit financing fell through in 2023. Private credit funds were demanding a spread of 525 basis points or more when banks were sidelined in 2023.
Credit market update
Leveraged loans
Leveraged loans returned 2.9% in Q42023 (measured by the Morningstar LSTA LL Index), following a 3.5% return in the prior quarter. Lower-rated credits underperformed versus the broader loan market, with the CCC Index returning 2.2% versus 3.2% for the B Index. Mid-tier B-rated loans account for approximately 65% of the loan market as of year-end. Total issuance in the quarter was $74B, representing the lowest issuance quarter of 2023, though up approximately 10% versus Q42022.
 In terms of distressed activity, the leveraged loan distress ratio (measuring the percent of loans trading below 80% of par) ended Q42023 at 4.5%, up 0.2% versus the prior quarter and now well above the 10-year median of 3.0%. The LTM default rate as of Q42023 was 1.5%, also up 0.2% versus the prior quarter and now in line with the 10-year median. Downgrades continue to outpace upgrades, with a Q42023 downgrade-to-upgrade ratio of 2.4x, up from 1.7x in the prior quarter.
Healthcare, media/entertainment, and software are showing stress at levels above the overall market. Software/services represented 31% of distressed loans (those trading below 80% of par) in 2023, while healthcare represented 22% – combined, these two sectors constituted more than half of distressed loans in the year. Leveraged loan default activity in 2023 was similarly concentrated in healthcare (20% of defaults) and media/entertainment (23%). The market is already pricing in some level of stress in these sectors, as the weighted average bids on healthcare and media/entertainment loans were 2.9% and 2.4% below the All Loans Index, respectively.
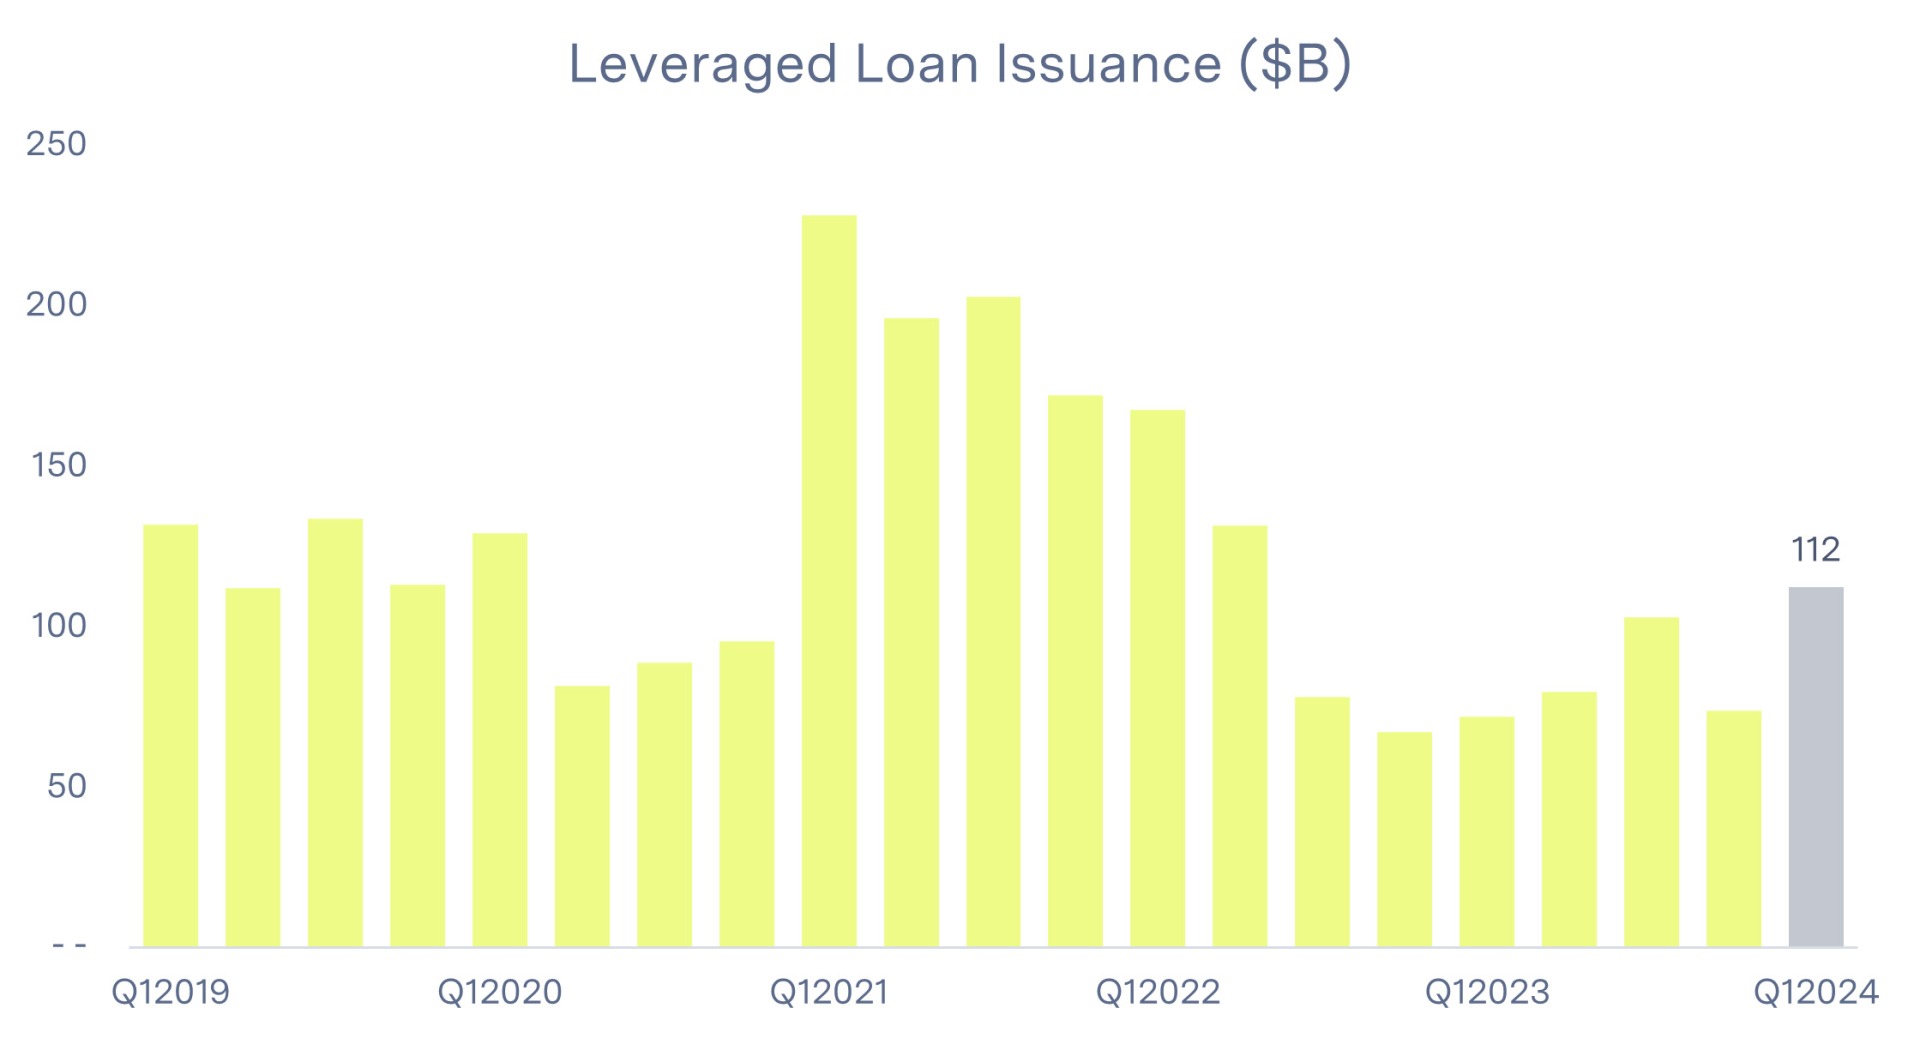
The real area of interest with respect to leveraged loans, however, is 2024 activity to date—the syndicated market is blazing hot in terms of new issuance to start the year. Loan spreads (measured by spread-to-maturity) have tightened to approximately 445 basis points, 65 basis points below mid-2023 levels and the lowest spread since May of 2022. Issuers have taken advantage; leveraged loan issuance through February totals $112B, with Q12024 already representing the highest quarter of issuance since Q22022 with one month remaining in the quarter. Declining spreads are driving companies to opportunistically refinance and extend debt maturities and could result in accelerating M&A. Moreover, a record pace of CLO origination and retail inflows are buoying new issuance.
High-yield bonds
High-yield bonds returned 7.1% in Q42023 (measured by the Morningstar US High Yield Bond Index) following a 0.6% return in the prior quarter and representing the best quarterly return for high-yield bonds since Q22020. Spreads continued the downward trajectory seen through most of 2023, ending the quarter at 340 basis points versus 403 basis points the prior quarter per the ICE Bank of America High Yield Index. Total issuance in the quarter was $41B, approximately flat versus the prior quarter though more than double the amount in Q42022 ($15B).
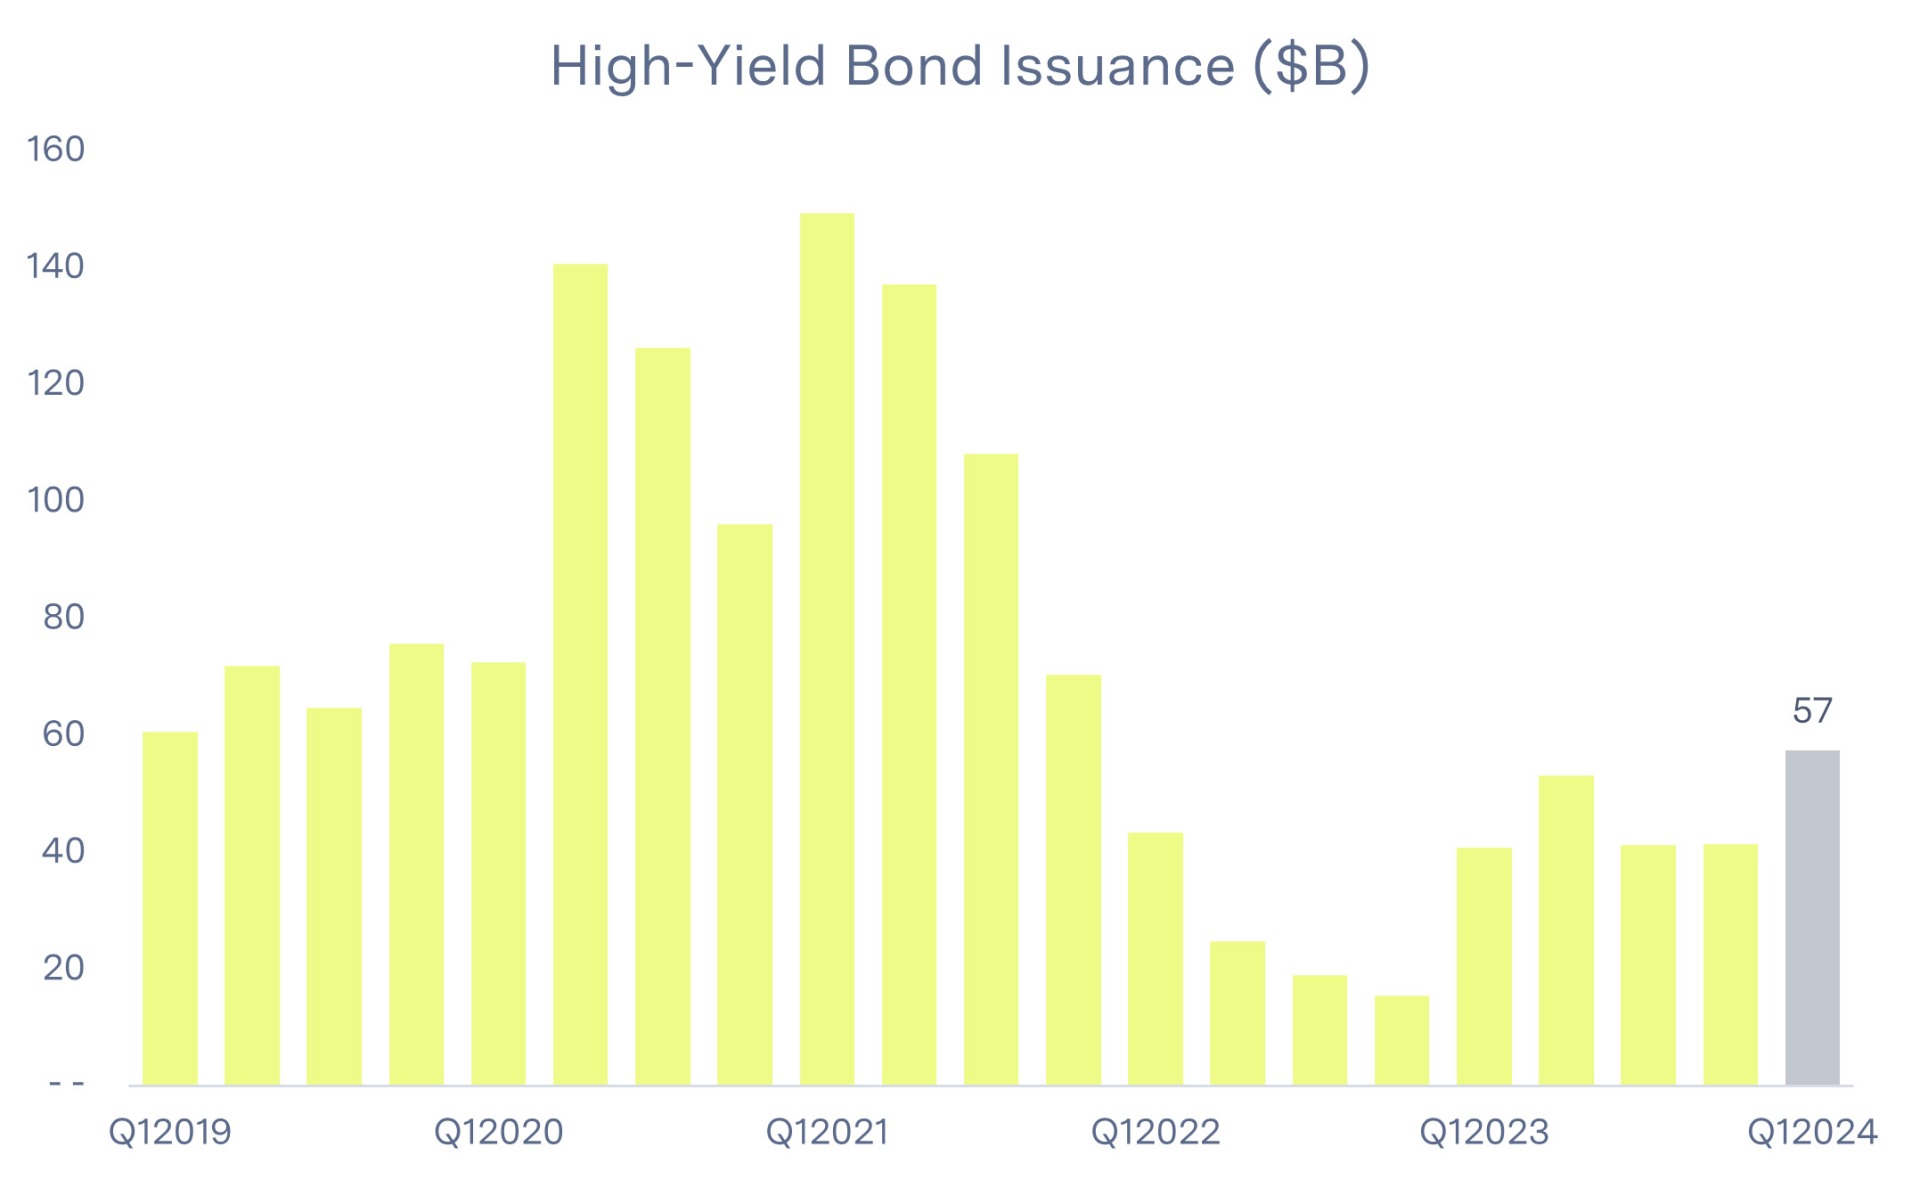 As with leveraged loans, the most interesting metric remains activity to-date in 2024. Spreads have tightened an additional 10 basis points – and following the tightening seen in Q42023, issuers are taking advantage of advantageous pricing. High-yield issuance is red hot in the new year – $57B issued through February represents the third fastest issuance start to a year on record, trailing only 2020 and 2021. Similar to loans, the vast majority of new issuance is refinancing-focused, as issuers opportunistically extend debt maturities.
Distressed activity was muted if not marginally positive during the quarter, with the distress ratio on the S&P US High Yield Corporate Bond Index (measured by issuers trading at or above an option-adjusted spread of 1,000 basis points) ending Q42023 at 6.4%, down from 6.5% the prior quarter. Distress is most concentrated in media (20% of distressed issuers), healthcare (19%), and telecom (16%), similar industries to that seen in the leveraged loan market.
Private credit (BDCs)
Private credit / BDC fundamentals continue to exhibit underlying strength – though as with leveraged loans and high- yield bonds, distress is modestly increasing or forecasted to increase. Portfolio marks (fair value to cost) were fairly flat quarter-over-quarter, as were net asset values. Underlying portfolio company interest coverage (where disclosed) was near unchanged versus the prior quarter, though unsurprisingly remains below 2021/2022 levels given the rise in base rates.
“We’ve said this in the past that we’re likely to see defaults in the industry just increase this year. In the bottom quartile of our portfolio and probably everybody else’s, you have some companies that are making interest payments but continue to live off revolver availability, cash, etc., but the liquidity is getting tighter and tighter.” – Ares Capital Corporation CEO, Kipp DeVeer
Underlying borrower EBITDA additionally continues to trend positive. Ares Capital Corporation (ARCC) and Blackstone Secured Lending Fund (BXSL) both reported LTM weighted average portfolio company EBITDA growth of 9% in Q42023. The Golub Capital Altman Index – measuring median revenue and earnings growth of 110 – 150 companies in the Golub Capital loan portfolio – additionally showed 16% year-over-year earnings growth in Q42023, led by technology firms but with strength across all other sectors (consumer, healthcare, industrial).
Non-accruals (i.e. defaulted positions) continue to trend higher in some parts of the market. Across seven large-cap BDCs, non-accruals on average represented 2.5% of the total portfolio, up from 2.0% the prior quarter driven primarily by one particular BDC with a large increase in non-accrual rates (excluding this name, non-accruals were approximately flat). Credit quality continues to outperform expectations against the rise in base rates – but as liquidity conditions remain tight, defaults are likely to trend higher to more historically “normal” levels.
Bankruptcy & restructuring
 Q42023 was a busy quarter for distressed activity, as bankruptcy filings continued their upward trend and restructuring mandates rebounded from dampened Q42021 and Q42022 levels. With 1,529 commercial chapter 11 filings (excluding subchapter V) in the quarter, Q42023 represented the largest quarter of filings since the COVID-impacted Q32020 and more than double the same period a year ago. Chapter 7 commercial filings totaled 3,450, flat versus the prior quarter though up approximately 15% versus the same period a year ago.
In what is typically a slower period for activity, Debtwire reported 441 restructuring mandates in Q42023 across 97 companies, up approximately 60% versus Q42022 and Q42021. Activity was most concentrated in healthcare (85 mandates), real estate (38), and technology (42). Restructuring fee events at Houlihan Lokey (HLI) were additionally modestly up versus the same period a year ago (30 fee events in Q42023 versus 28 in Q42022), with 129 restructuring fee events in 2023 versus 93 in 2022. Given trends in the credit markets, we would expect a continued upward trend in commercial chapter 11 filings and higher mandate activity in the near to mid-term.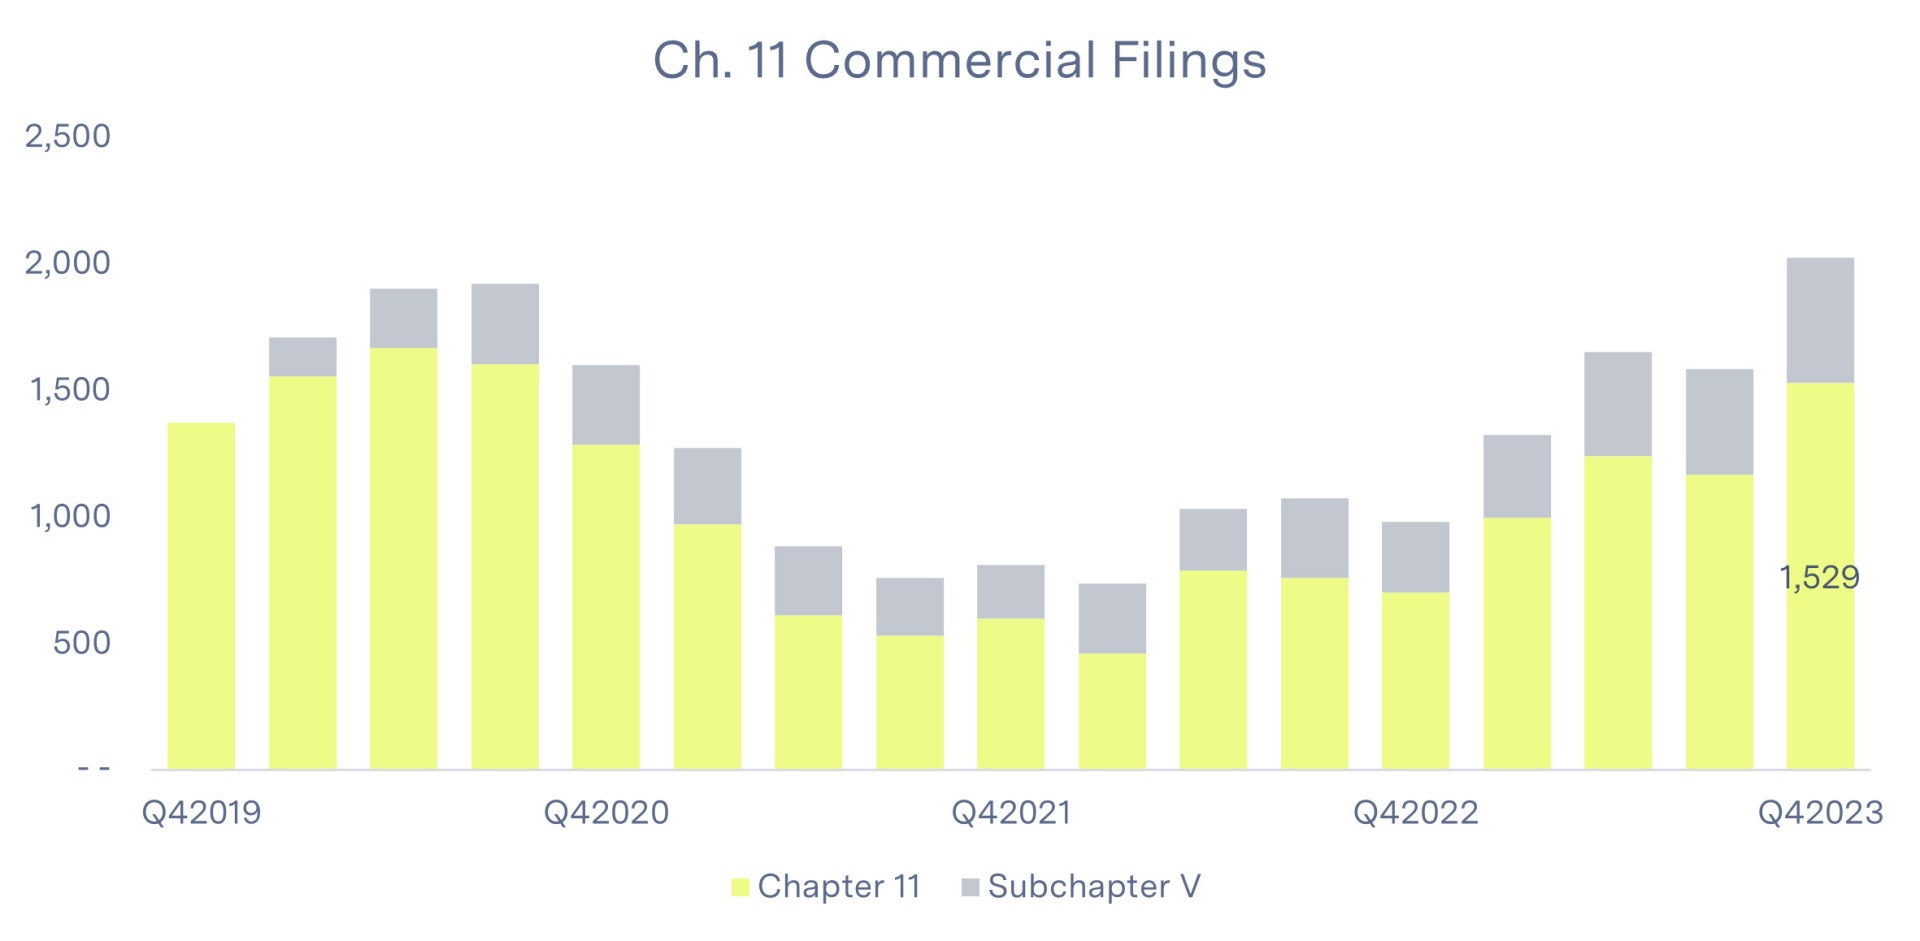
Conclusion
In summary, Q42023 distress trends largely represent a continuation of those seen throughout the year. Distress continues to increase, but off the abnormally low levels seen in 2021 and 2022 to a more historically normalized basis. Filings continue to trend higher thus far into 2024—commercial chapter 11 filings in February were almost double those seen in January, with Q12024 filings through February up 70% versus the comparable period in 2023. As liquidity conditions remain tight in a high-rate environment, we continue to expect a modest pickup in turnaround and restructuring activity, with healthcare, real estate, and consumer-centric industries expected to show relatively higher stress.
Sources:
- PitchBook & PitchBook LCD
- S&P Capital IQ Pro
- Public filings, company presentations, and earnings call transcripts
- Debtwire
- Epiq Bankruptcy