Accordion's distressed & restructuring year in review & 2024 outlook


Accordion's Distressed & Restructuring Year in Review & 2024 Outlook
EXECUTIVE SUMMARY
During prior cycles, restructuring professionals have learned to expect the unexpected—and 2023 was no different. Interest rates rose to levels not seen since the Great Financial Crisis—at the quickest pace since the 1980s—and macroeconomic inflationary headwinds created further pressures. Restructuring activity increased versus prior years due to elevated corporate distress, but likely not to the levels that many expected (or hoped for!), with lenders, sponsors, and portfolio companies using creative measures to preserve or enhance liquidity. Increased filings and defaults in 2023 were in stark contrast to both equity markets finishing the year near all-time highs, and corporate borrowers continuing to report healthy revenue and EBITDA levels.
Looking ahead, 2024 may represent the year in which “pandemic-era excess” —notably consumer spending and corporate leverage—comes back to bite companies. Certain highly levered legacy vintage LBOs, many from 2020 and 2021 executed at low rates and historically high leverage, face unsustainable capital structures from the rise in base rates and may struggle to generate sufficient cash flow for both investment and debt service. After years of robust spending, the consumer is now more pessimistic, with consumer debt and delinquencies ticking higher and COVID-era savings now essentially wiped out. As a consequence, 2024 should bring opportunities for lenders with flexible mandates and dry powder, whether refinancing legacy lenders, converting debt to equity ownership, or investing tactically in post-restructuring deals at favorable terms.
Restructuring activity is poised to increase again in 2024, though any build in distress is likely to be methodical and steady versus a sudden surge (absent unanticipated disruptive circumstances). Weaker credits in commercial real estate, consumer-centric industries, and healthcare look to be most at risk—with idiosyncratic issues to each sector overlaid with higher financing costs from the rise in rates.
2023 Year In Review
Positive returns, Positive Fundamentals
It was not the year that many in the restructuring industry expected—against a cloudy macroeconomic outlook and continued rate increases, few would have predicted equity markets to close near all-time highs, leveraged loans to post their best returns since 2009, and private capital (debt and equity) fundamentals to remain broadly healthy.
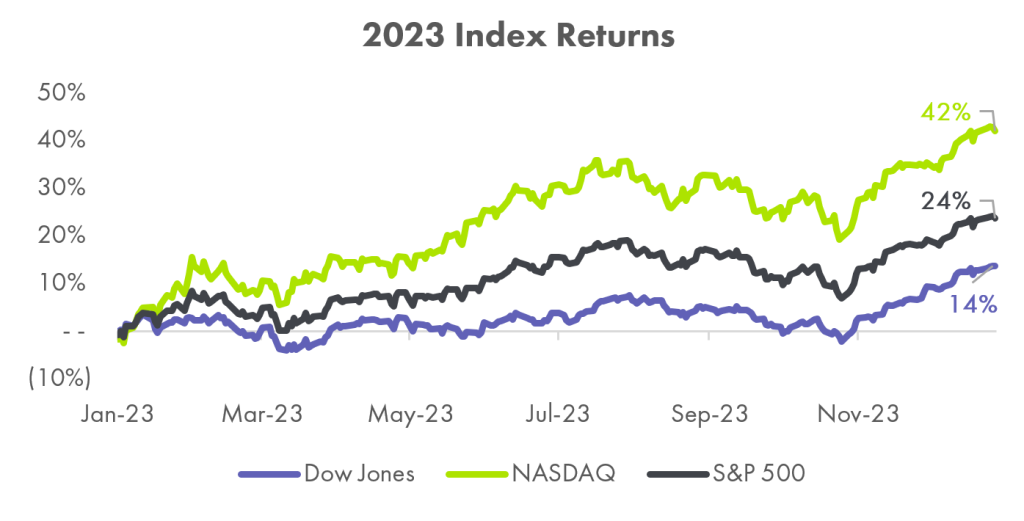
While the first ten months of the year posted flat to moderate returns (at least for the S&P500 and DJIA) on the back of a robust yet hesitant economy with easing inflation, it wasn’t until the Federal Reserve held rates flat at their November 1st meeting that equity markets began to surge. After the quickest rate hike cycle since the 1980s, the call to “hold steady” for a second month in a row indicated to many that this upward rate hike cycle may be over. Soon after, at their December 2023 meeting, the Fed pointed to three potential quarter-point cuts to come during 2024, sending markets into a frenzy. Of the S&P 500’s 24% gain, 15% came in the final two months of the year—and perhaps more impressively, the entirety of the Dow’s 14% gain came in the same period. With markets now seemingly pricing in a soft landing, most major indices were able to erase 2022 losses and investors remain hopeful that the positive returns of 2023 may continue into the new year.
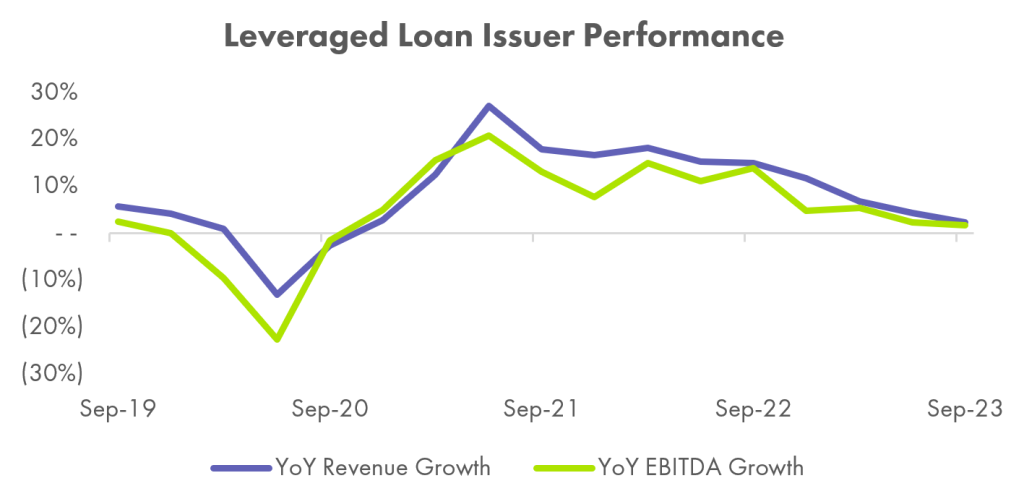
Leveraged loans simultaneously posted a record year with a total return on the Morningstar LSTA Leveraged Loan Index of 13.3%, ahead of any year since 2009, with weaker-rated credits generally outperforming as the CCC Index returned 17.6%. Loan fundamentals (excluding interest coverage) also remain strong—with positive (albeit weaker) year-over-year revenue and EBITDA growth through Q3’23 after tough comps from 2022. With approximately half of the leveraged loan market comprised of sponsor-backed companies, it is unsurprising that fundamental strength in this sector matched that of private equity. Blackstone, for example, noted in Q3’23 that its portfolio companies reported “resilient, single-digit revenue growth with strong margin performance as cost pressures continued to abate”—combined with a 12.4% LTM appreciation in its Corporate Private Equity portfolio. Apollo similarly reported a 16% LTM appreciation in its flagship Private Equity strategy in Q3’23 and noted that portfolio companies continue to generate earnings growth.
This performance is consistent with the fundamental strength seen in private credit. Ares Capital Corporation (ARCC) reported underlying year-over-year LTM EBITDA growth of 6% for its portfolio companies in Q3’23. The Golub Capital Altman Index—based on median revenue and earnings growth of 110 – 150 companies in the Golub Capital loan portfolio—additionally reported year-over-year revenue and earnings growth of 7.4% and 16.3% in the first two months of Q4’23, the highest year-over-year earnings growth since Q2’21 with strength across several industry sub-sectors (most notably in tech).
Expectations vs. Reality
It was certainly a busy year for distressed activity, as deteriorating interest coverage from the rise in base rates combined with tough issuance markets led to elevated filings and increased restructuring mandates. However, 2023 was not the ‘banner restructuring year’ many expected, with a likely more apt comparison being 2019 activity. Even so, 2023 exhibited a methodical, steady build in distress, and the restructuring cycle to date looks more prolonged than (though not as deep as) the prior “boom and bust” cycles of 2008 and 2020.
Across different credit markets, 2023 showed a consistent trend: default rates were above 2021/2022, in line or above historical medians, and below 2020. The S&P Global U.S. speculative-grade LTM default rate was 4.4% in 2023 (historical median = 2.8%), driven by defaults in media/entertainment and consumer products representing 20% and 12% of the 2023 default count, respectively. The LTM leveraged loan default rate ended 2023 at 1.5%—significantly ahead of both 2021 and 2022 (0.3% and 0.7%, respectively) and almost in line with historical levels. Leveraged loan defaults in 2023 were split evenly between sponsor/non-sponsor deals and were most concentrated in healthcare representing approximately 30% of defaults by amount outstanding. Non-accrual data from business development company (BDC) filings shows a similar trend—with non-accruals as of Q3’23 up versus 2021 and 2022, though below the 2020 peak.
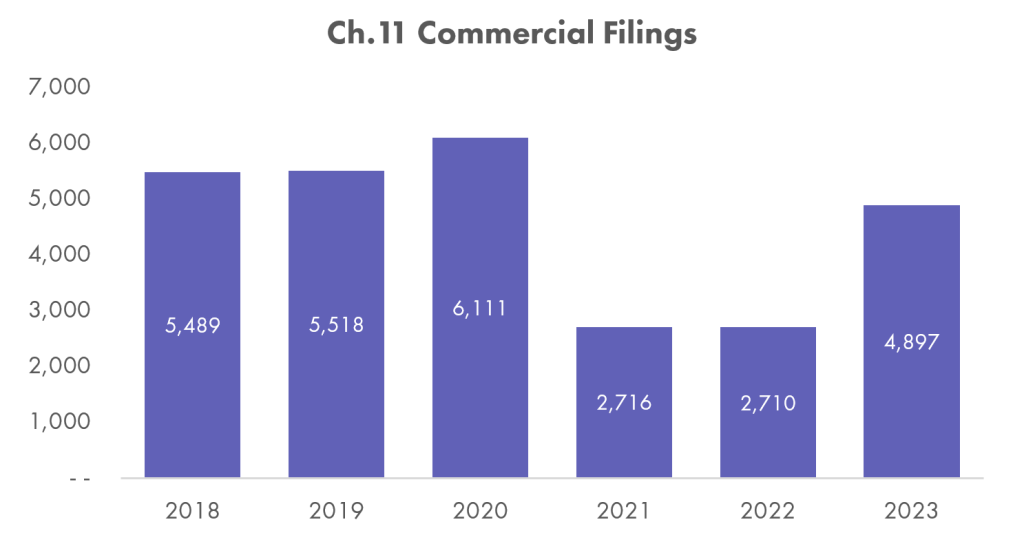
Higher default rates were accompanied by increases in commercial bankruptcy filings, though they remain below 2018 to 2020 levels. There were approximately 4,900 Chapter 11 (reorganization) filings in 2023 (excluding Subchapter 5 small business filings), up 80% versus 2021 and 2022 levels. Chapter 7 (liquidation) filings additionally totaled approximately 13,200 in the year, up 10% versus 2022 levels. The dollar value of debt being restructured through bankruptcy is also increasing. Chapter 11 filings in 2023 included 21 debtors with more than $1B in liabilities (including WeWork, Rite Aid, & Yellow Corp.). Separately, data from S&P’s global coverage universe shows nearly 600 large corporate filings in 2023 through November, ahead of any other year over the last decade excluding 2020.
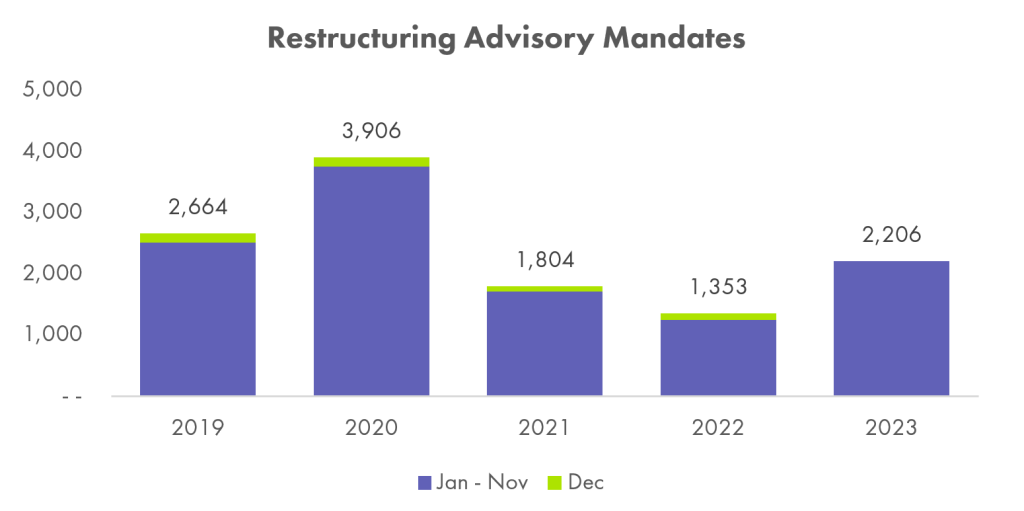
As bankruptcy filings and defaults increased, so did restructuring activity with restructuring mandates in 2023 rebounding from tempered 2021 and 2022 levels. Through November 2023, restructuring mandates reported by Debtwire totaled approximately 2,200, a 30% and 80% increase from the same periods in 2021 and 2022, respectively, with healthcare (468 mandates), retail (266), and financial services (158) drove 40% of the mandate count. Note that reported mandates represent only a fraction of the restructuring market, with much of out-of-court restructuring activity being unreported. Restructuring data from boutique investment banks paints a slightly different picture. Houlihan Lokey (HLI) reported 99 restructuring mandates through the first nine months of the calendar year, up 25% and 50% versus the comparable period in 2021 and 2022, respectively, and on pace to equal 2020 activity.
It Takes Two to Tango
Against a pickup in distress, a punitive new issuance market, and a pressing maturity wall in the next two to three years, lenders and borrowers (and often private equity sponsors) were creative in delaying problems where possible, including amend and extend transactions, toggles to payment-in-kind (PIK) interest, and equity injections when needed. While certainly increasing breathing room for a troubled company, it is up for debate whether these maneuvers will simply defer distress from 2023 into future periods, especially if rates remain elevated.
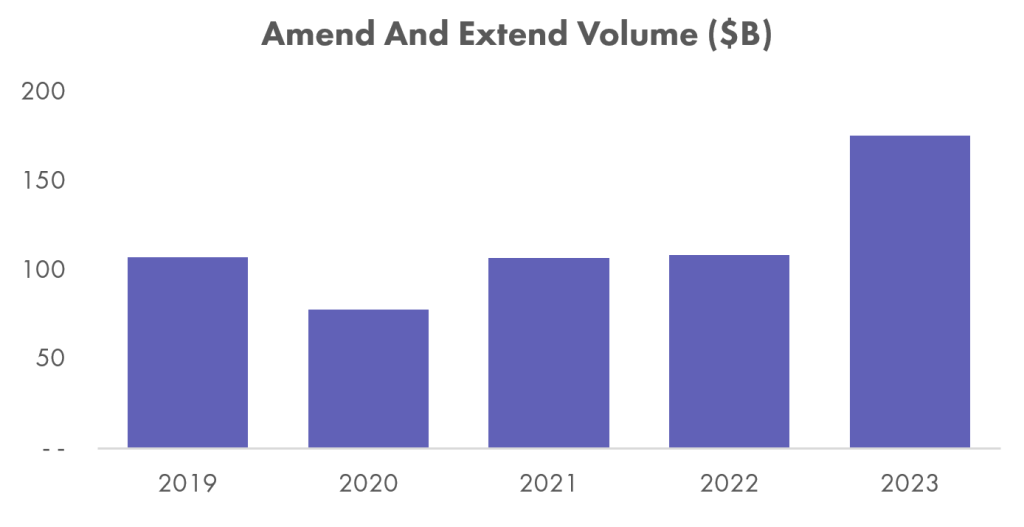
Specific to the leveraged loan market, amend and extend volume (wherein loan issuers delay maturities via an amendment instead of refinancing via a new issuance or other measure) surged in 2023. For 2023, amend and extend volume totaled $176B, ahead of any year since at least 2014 and well above the 2022 full-year value of $110B. Amend and extend volume in 2023 was split 50/50 between sponsored and non-sponsored issuers, a notable difference versus prior years—in 2022 for example, 75% of such transactions involved non-sponsored issuers.
The surge in leveraged loan amend and extend transactions has not been matched by a similarly sized increase in other covenant-relief amendments, though they are above 2021 and 2022 levels. For 2023, PitchBook LCD tracked approximately 41 covenant-relief transactions in the leveraged loan market—ahead of 2021(30) and approximately in-line with 2022 (42), though still well below COVID levels (193 in 2020). This matches commentary in private credit (BDCs), with many managers in Q3’23 reporting that they have not yet seen a meaningful pickup in covenant-relief amendment requests from borrowers. Whether the trend of muted amendments in private credit and leveraged loans continues to hold in 2024 remains to be seen, but at least a modest increase in amendment activity looks likely given increased distress levels.
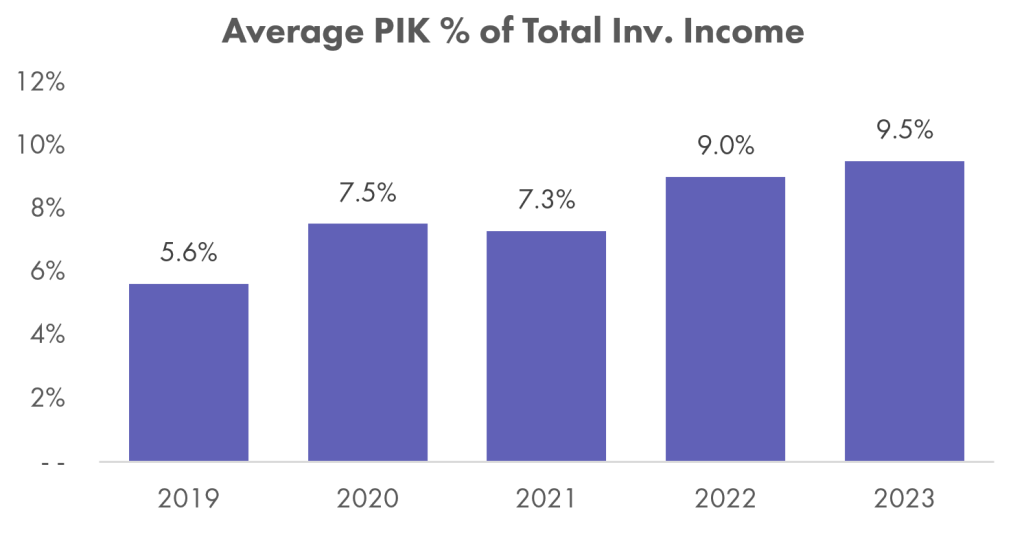
PIK interest has increased vs. both recent years and 2019 levels in private credit. An analysis of five large public BDCs indicates payment-in-kind income represented, on average, approximately 10% of total investment income in 2023 through Q3’23—ahead of the full-year 2022 amount of 9% and well above the pre-COVID 2019 amount of approximately 6%. This trend matches a PitchBook LCD analysis on 15 BDCs in Q3’23 that identified 32 borrowers in the quarter that added a PIK component to their first-lien coupon that did not exist in Q2’23—with 14 of those 32 borrowers converting more than half of their total interest to PIK. To be clear, PIK levels still remain fairly low in the BDC space (with the limited analysis of the five large BDCs likely not representative of the entire market)—and PIK alone is not indicative of higher stress. Even so, elevated PIK will increase cash interest payments when a portfolio company returns to cash pay, with an added principal repayment burden upon maturity of the loan.
2024 Outlook
Capital Structure Matters
As the economy navigates a prolonged period of higher rates, dealmakers and CFOs continue to face headwinds. For nearly two decades, the tried-and-true private equity strategy of using leverage as a supplement to other value creation efforts has proven highly successful. Against the dual threat of higher-for-longer rates and potential macro pressures, highly leveraged legacy transactions—especially 2020 and 2021 vintage deals executed at historically low interest rates—may struggle to generate cash flow sufficient to both cover debt service obligations and fully invest in the business.
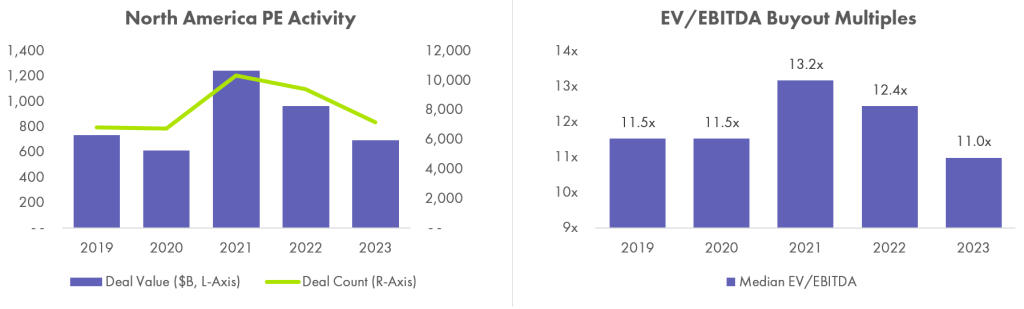
From 2020 to 2022, PitchBook estimates that approximately $2.8T of PE deal value was transacted, including a record $1.2T in 2021: a period with (i) base rates at essentially zero (the current rising interest rate cycle not beginning until March 2022), (ii) bolstered company EBITDA from unexpectedly strong macroeconomic conditions, and (iii) robust consumer spending from government stimuli. Over the same timeframe, buyout multiples increased substantially. Per PitchBook, the median EV/EBITDA buyout multiple was 13.2x and 12.4x in 2021 and 2022, respectively, as compared to an average of 10.6x from 2013 to 2019. Median EV/Revenue multiples showed a similar trend at 2.6x and 2.4x in 2021 and 2022 versus a historical average of 1.6x.
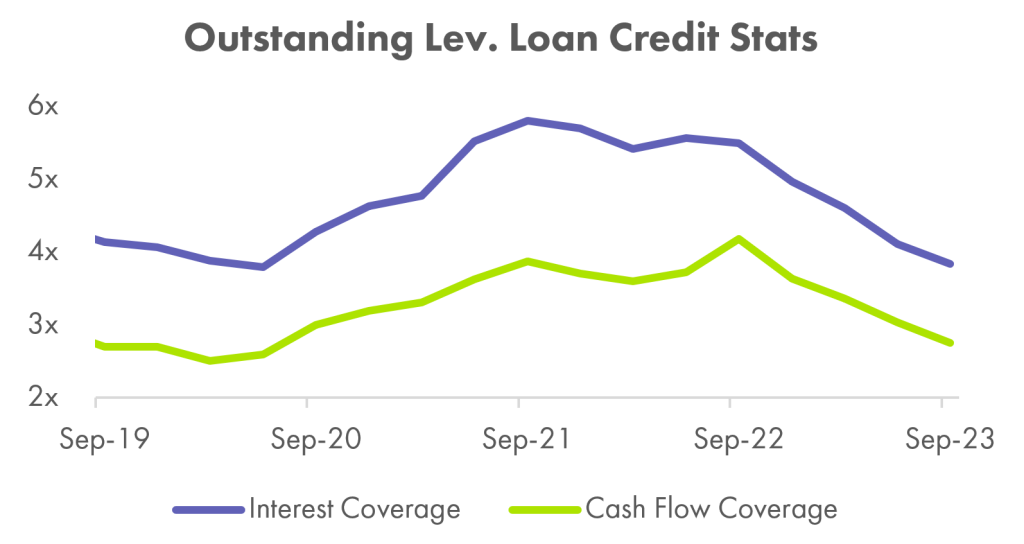
This frenzy of deal activity in 2021 was soon followed by a sharp increase in rates beginning in March 2022. Interest coverage ratios broadly dropped—weighted average interest coverage for leveraged loans fell to 3.8x in Q3’23 (down from 5.5x one year earlier), and private credit/BDCs reported similar trends.
Elevated buyout multiples at elevated EBITDAs have pushed an outsized amount of debt onto companies that have transacted over the last few years. This fact, combined with higher rates (as compared to what was likely underwritten) and potential economic headwinds heading into 2024 should, at the margin, increase distress levels in the coming year, especially for weaker-rated credits. Issues from legacy capital structures are likely to come into play in 2024, and Accordion continues to believe restructuring activity will increase over the near-to-mid term driven by corporate balance sheets.
The Conscious Consumer
After the flush years of 2021 and 2022, consumer spending levels are beginning to normalize. Personal consumption expenditures (PCE, a macro measure for consumer spend) were up approximately 5% year-over-year in November 2023 and up 3% exclusive of inflation. The November and December 2023 holiday sales period additionally exceeded the prior year at a level stronger than many had forecasted. Even so, the consumer wallet is beginning to show signs of stress—more consumers are reporting their financial situation to be worse off, pandemic-era excess savings have now essentially been wiped out with savings rates below historical medians, and credit card delinquencies are climbing. Given the consumer’s outsized impact on GDP, the outlook for consumer spending (and more broadly, the financial health of the consumer) will have a material impact on the macro environment in 2024.
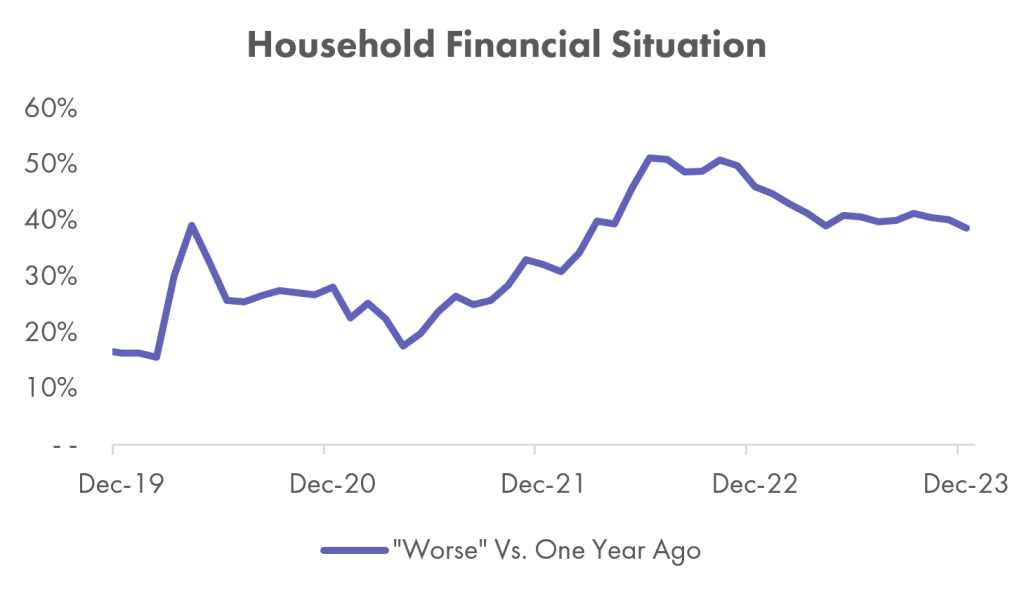
Consumer spending is in part driven by an individual’s current finances – a healthy assessment by a consumer is likely to spur additional spending, especially on discretionary items. Reporting from the New York Fed’s Survey of Household Expectations (a periodic survey of 1,300 household heads), however, indicates that many consumers remain pessimistic about their situation. Approximately 40% of households in December 2023 indicated their current financial situation was worse versus one year ago, with 10% of households indicating “much worse” and 29% indicating “somewhat worse”. Both values stand in stark contrast to pre-pandemic levels (3% and 13% in December 2019, respectively) and historical medians.
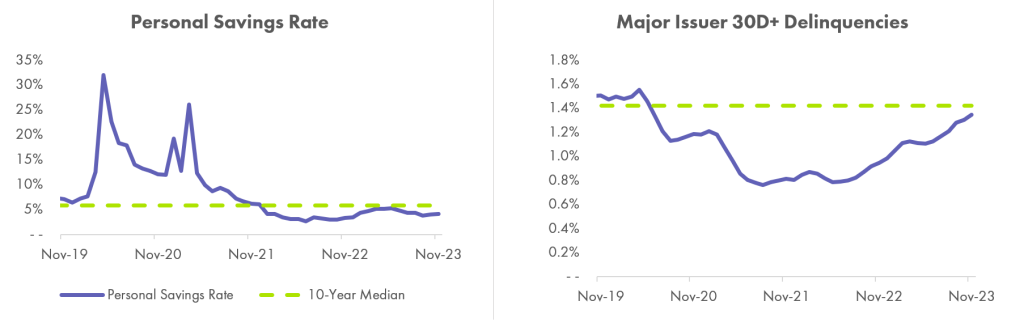
The pessimism evidenced in this survey is corroborated by declining savings rates and increasing delinquencies. Personal savings rates now sit well below 2020 and 2021 levels (these periods, however, represent historical outliers), with the November 2023 personal savings rate of 4.1% below the 10-year median value of 5.8% and the pre-COVID value of 6.4%. Additionally, in November 2023, 30+ day delinquencies across the six major credit card issuers averaged 1.3%—up from 0.9% one year ago, representing the fourth consecutive month where average delinquencies increased 0.4% year-over-year. Average delinquency rates have not increased at this level since 2009, with delinquency rates rising the fastest for low-income demographics (per the New York Fed).
The Rise of Credit Funds
With surging investor interest and allocations (most notably seen in 2021 and 2022 fundraising levels), many believe the “golden age of private credit” is here and here to stay. To some, like Institutional Investor, it represents arguably “the most powerful transformational force in the financial world since the 2008 economic crisis.” Across interval funds, BDCs, and middle-market CLOs, private credit financing has grown as a viable alternative to the traditional broadly syndicated loan (BSL) market in competing to offer debt financing to non-investment grade, typically sponsor-backed credits.
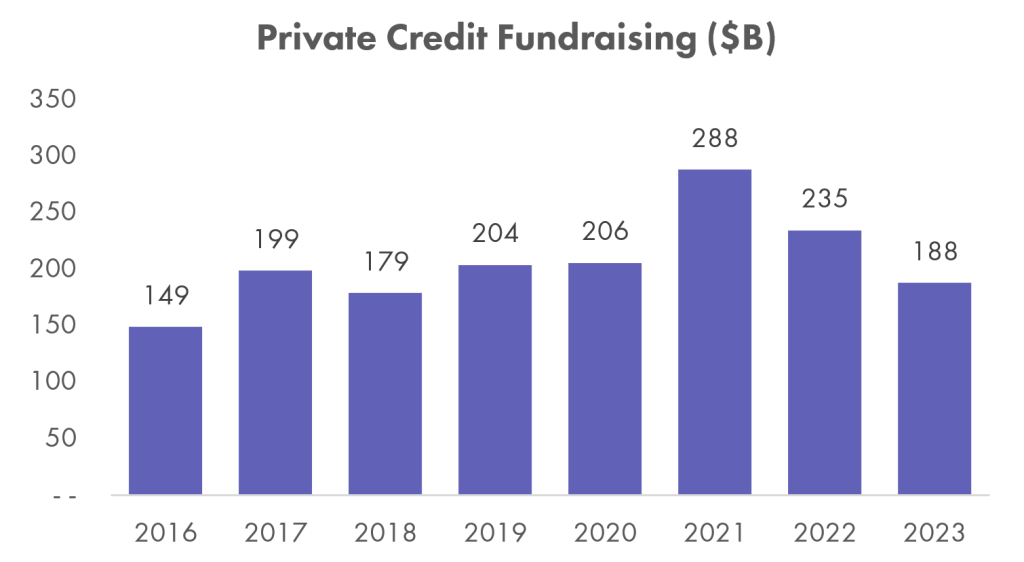
After a banner 2021 and 2022, private credit fundraising slowed in 2023—in part due to lower retail (accredited investor) fundraising, an important source of new capital for investment managers. PitchBook estimates private credit retail fundraising averaged $12B per quarter in 2022, though totaled only $17B in the first half of 2023, a reduction of 30%. Retail-oriented credit vehicles like new large non-traded BDCs saw material growth in 2021 and 2022. Take Blackstone Private Credit Fund (BCRED), for example, which was established in Q4’20. Just two years later, BCRED’s portfolio totaled approximately $45B, and since then through 2023, assets have remained stable around the $48B level.
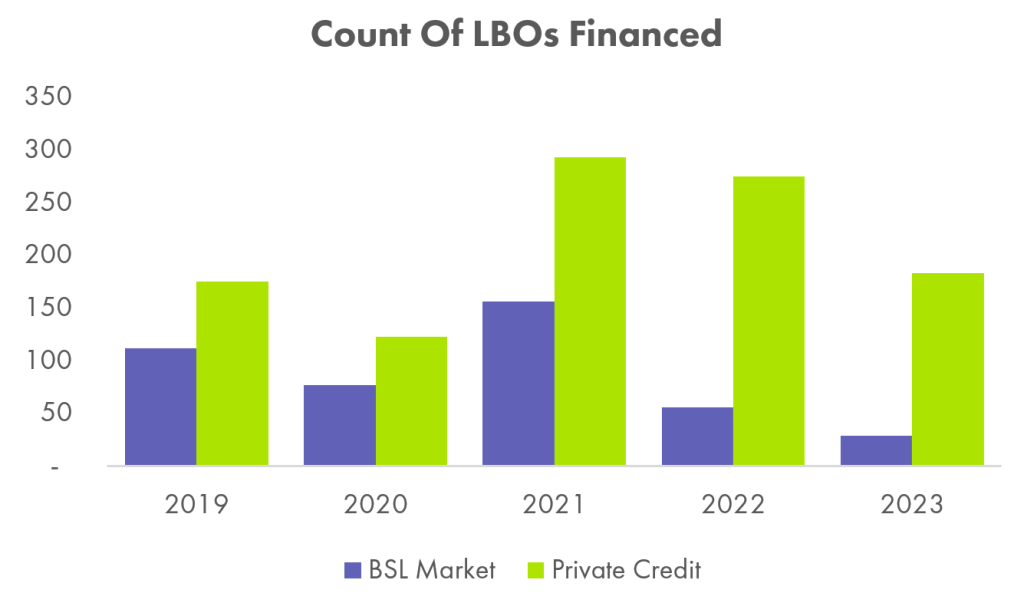
After the fundraising strength of recent years, private credit managers have meaningful cash ready to deploy, with PitchBook estimating dry powder at year-end 2022 of $434B. In addition to the generally more flexible terms that private credit can offer borrowers, the size of the private credit war chest is changing the marketplace. For every LBO financed via the syndicated market in 2023, approximately six were financed via private credit—up from 1-to-5 one year ago and 1-to-2 in 2021.
2024 should bring a swath of opportunities for private credit funds with flexible mandates and dry powder. With distressed activity on the rise, funds can be tactical in investing in post-restructuring deals at favorable terms and refinancing legacy lenders. Additionally, should existing portfolio credits default on outstanding obligations, credit funds may have meaningful opportunities to conduct distressed exchanges and drive value as an equity holder—which may be one of the biggest differentiating factors in returns.
Sectors at risk
Middle-market companies are likely more exposed to further increases in distress versus larger companies, given more limited financing availability and greater difficulty in passing on higher input costs to end consumers. While many sectors may see difficulties in 2024, we highlight a few that are particularly notable.
Commercial Real Estate (CRE)
In what is certainly a consensus choice, commercial real estate remains an obvious candidate as an at-risk sector in 2024—impacted by the confluence of decreased asset values, higher capitalization rates from the increase in base rates, higher debt service, and looming loan maturities. To be clear, these represent a continuation of trends from 2022 and 2023 rather than any specific new event, though rates alone are likely sufficient to increase stress for at-risk CRE borrowers.
Actual credit distress in CRE to date remains fairly muted, though it is accelerating. Per the St. Louis Fed, CRE delinquency rate at commercial banks was 1.1% in Q3’23, up from 0.9% in the prior quarter and now in line with the pandemic-era high of 1.1% in Q4’20. Note that this 0.2% increase represents the largest quarter-over-quarter increase in more than ten years, and delinquencies now sit above the historical 10-year median of 0.9%.
Office CRE is of particular concern, affected by all the aforementioned trends with the added impact of (i) a pullback in bank lending combined with (ii) what appears to be a permanent shift to increased hybrid/remote work. Equity markets have been pricing in risk in office CRE since 2020, with publicly traded office REITs trading at a 28% median discount to NAV (versus 11% for all REITs). Non-performing loan (NPL) rates specific to the office sector have also increased in recent quarters; at Wells Fargo and Bank of America, for example, office NPLs represented 8.7% and 6.0% of total office loans in Q3’23, up from 4.6% and 4.0% in the prior quarter.
Consumer Centric
As the consumer’s wallet begins to show cracks (continued pessimism surrounding their financial situation, depleted savings, and increased delinquencies), consumer-exposed industries sit at risk from a pullback in consumer spending. Restaurants, retail, and discretionary consumer products are prime candidates as the “first target” for pinched consumers to cut out of their budgets, and any macro pressures specific to the consumer would likely soon impact corporate top lines. The consumer products sector has already shown signs of stress in 2023 with the industry representing the second-highest number of defaults per S&P Global’s speculative-grade default list.
Consumer spending is additionally likely to be pressured by the resumption of student loan repayments, with 2024 representing the first full year of student loan payments since COVID. Any macro “soft-landing” would be a welcome development to the consumer and to industries relying on discretionary spend. Anything more extreme or a notable deterioration in consumer finances would likely drive higher restructuring activity in the industry.
Healthcare
Healthcare distress levels were notable in 2023, with the industry representing 30% of leveraged loan defaults during the year and 20% of reported restructuring mandates (468 mandates specific to healthcare). Warning signs continue to flash, as providers get squeezed by increases in commercial payment levels, flat or decreased payments from government payors, and a constantly shifting regulatory environment with notable policy changes in 2023.
Per S&P Global, EBITDA margins specific to the healthcare services sub-sector remain below pre-pandemic levels, most notably from sustained higher labor costs, while sub-sector peer margins (healthcare equipment and pharma) have remained stable or modestly improved. Lower margins combined with higher debt service from the rise in base rates and the higher leverage of healthcare services versus other healthcare sub-sectors is likely to drive continued pressure on liquidity in 2024. Healthcare demand, though, is a constant—and any improvements in labor availability or easing of other input cost inflation would improve a challenging operating environment, with forecasted base rate decreases as a potential tailwind to cash generation. However, consolidating healthcare ownership, new partnerships, drug pricing, and tech innovation may also drive disruption.
Sources:
- PitchBook & PitchBook LCD
- S&P Capital IQ
- New York Federal Reserve
- St. Louis Federal Reserve
- Debtwire
- Public company filings and presentations
About the Authors